Do you know how your social media, blog, public relations, and website performance compare against your industry average? TrackMaven’s 2017 Digital Marketing Analytics Performance Report provides these answers and more.
Our latest research effort goes far beyond broad best practices by drilling down to industry-specific benchmarks for 13 industries and 39 sub-industries. Using our marketing analytics platform, we analyzed 12 months of data from over 700 leading brands to understand the big-picture trends in digital marketing effectiveness.
The result? You finally have the ability to put your brand’s performance in the context of your competitive industry.
The insights and industry benchmarks provided in this report reveal:
- Which social networks really attract and engage audiences for brands in each industry;
- The top-of-funnel impact of blog engagement and public relations performance;
- Which industries have the healthiest websites, and which underperform.
For example, here’s a look at the social media marketing landscape in one summary chart from our report.
The social media marketing landscape in one chart
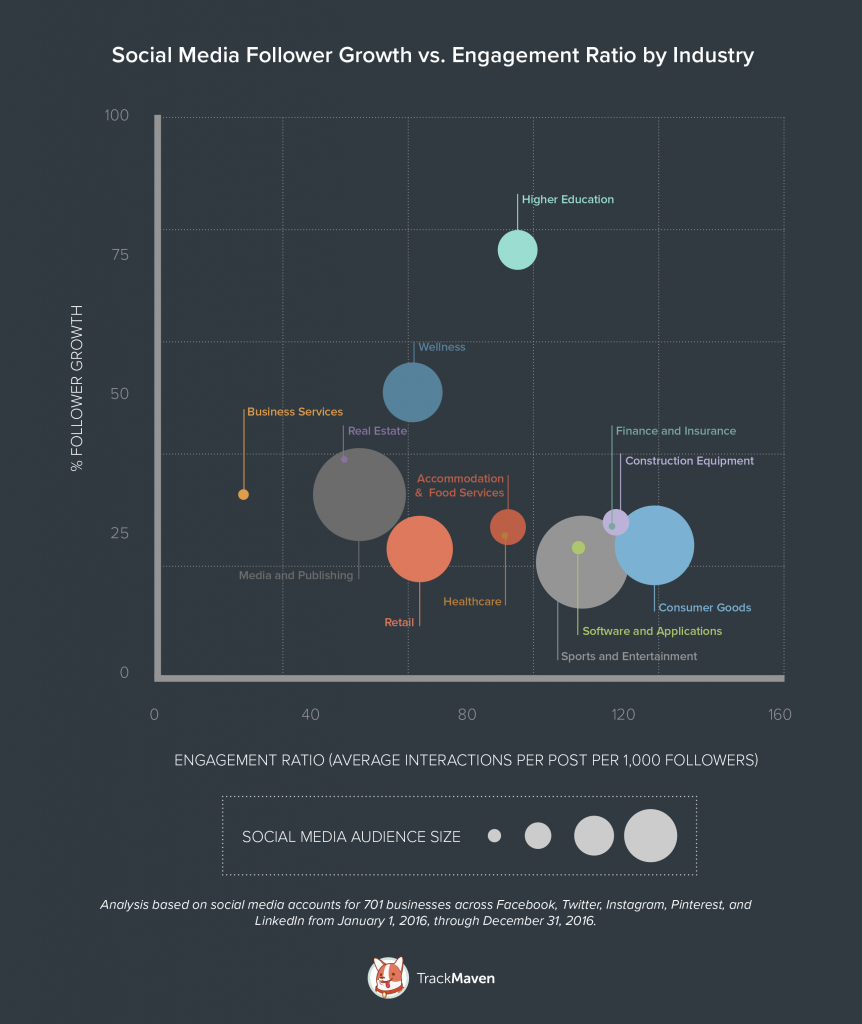
Which industries are the most successful on social media? The graph below offers a high-level answer.
This graph plots the average social media follower growth and social media engagement — measured across Facebook, Twitter, LinkedIn, Instagram, and Pinterest — by industry.
Industries with the greatest average follower growth per brand score highest along the y-axis. Industries with the highest engagement ratio — measured as the average number of interactions per post per 1,000 followers — score highest along the x-axis. The size of the bubble reflects the average total social media audience size for a brand in each industry across Facebook, Twitter, LinkedIn, Instagram, and Pinterest combined.
In a nutshell, if your business goal is to both engage your social media audience and attract new followers, you should aspire to be in the top right quadrant of this graph. Score high on the y-axis but low on the x-axis, and your brand’s digital audience is growing, but your content fails to engage your audience. Score high on the x-axis but low on the y-axis, and your audience is engaged on social media, but your content is not effective at attracting new followers and potential customers.
So which industries are most competitive and compelling on social media? Here are just a few of the key takeaways:
- Higher education, finance and insurance, and construction products brands are in the social media sweet spot: Businesses in these three industries rank in the top 50th percentile for both average social media audience growth and average social media engagement ratio. Put differently, brands in these three industries are both growing and engaging their digital audiences.
- Consumer goods businesses are most effective at audience engagement: With an average engagement ratio of 123.92, consumer goods brands have the most engaging social media presence, making this a highly competitive industry to stand out on social. The finance and insurance industry (119.35) and construction and equipment industry (118.37) come in second and third place by this metric, respectively.
- The higher education industry is skyrocketing on social: Higher education institutions saw the highest social media follower growth across the social media landscape in 2016, with 77 percent annual follower growth on average. Engaging social media content is a correlated factor; the higher education industry ranks sixth out of the 13 industries in our analysis in terms of average social media engagement. The wellness industry comes in second place with 50.45 percent average follower growth across the year. For businesses in these industries, new audience growth is key to be competitive.
Overarching benchmarks any brand can use
Want to know how brands perform on different marketing channels across industries? Take a look at our summary report, covering all of the brands we examined.
Comprehensive digital marketing analytics benchmarks for your industry
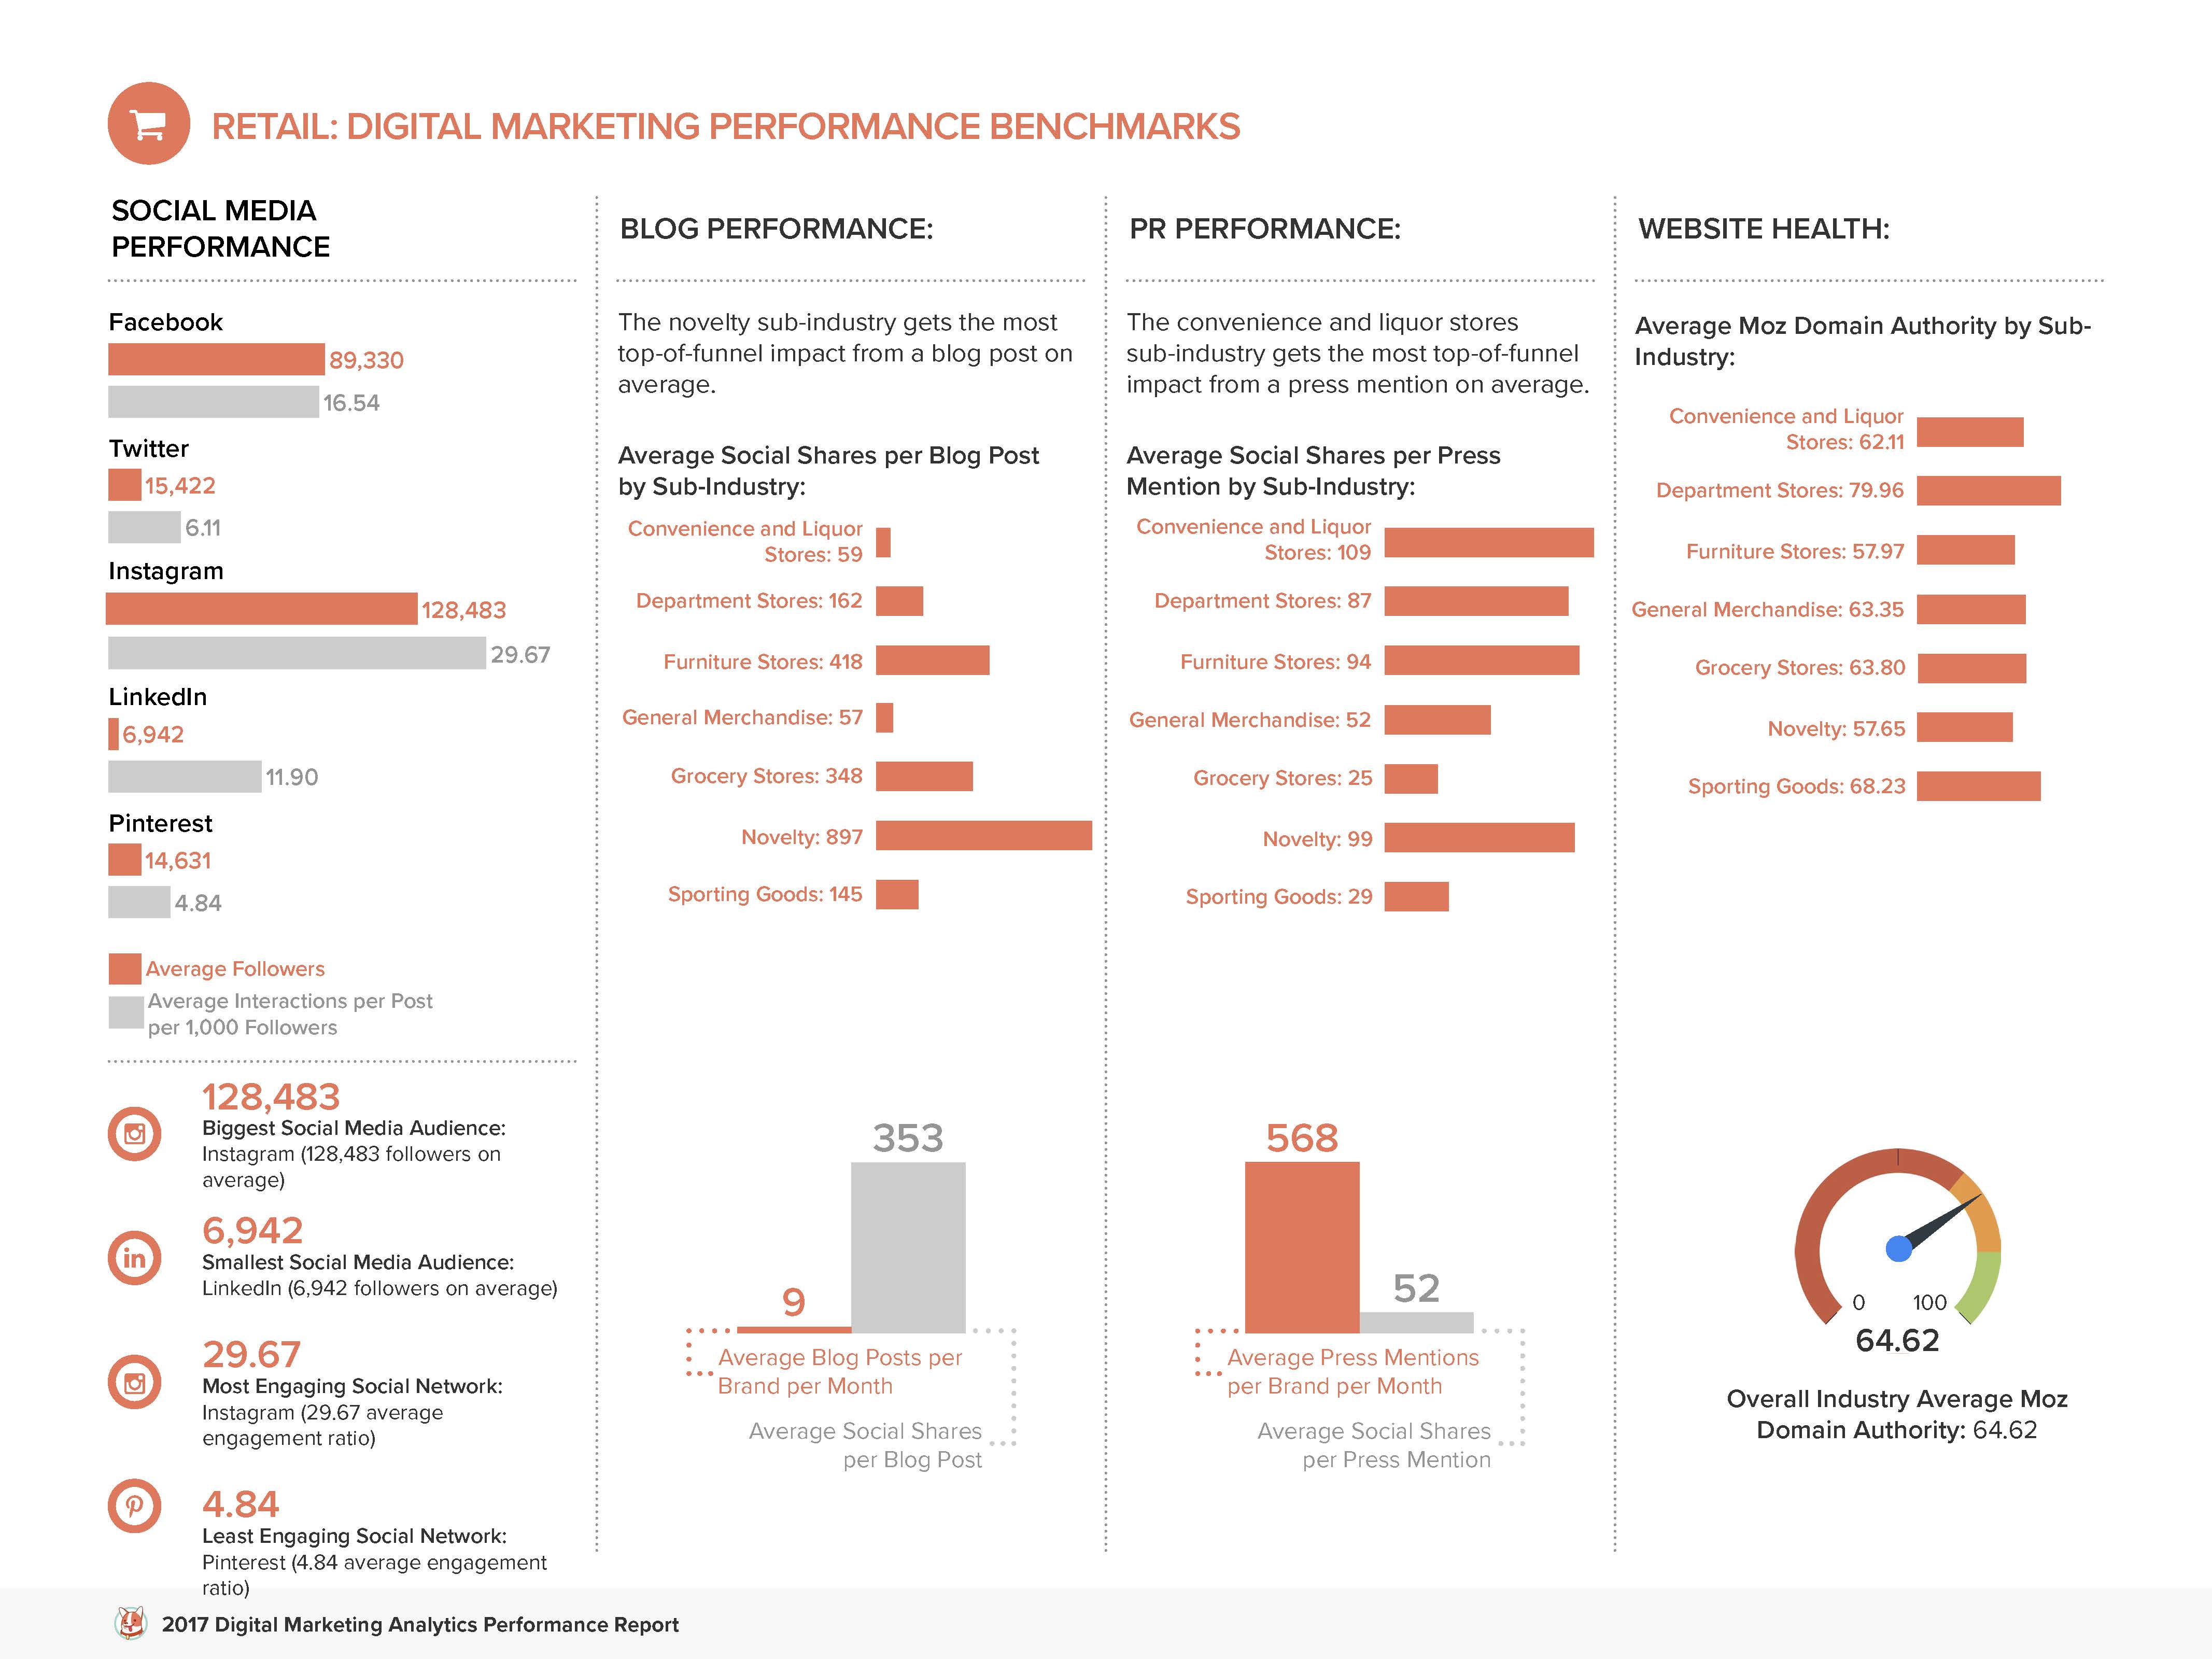
The 2017 Digital Marketing Analytics Performance Report covers much more than just social media performance. It also features comprehensive digital marketing analytics benchmarks for your industry — including website health metrics, blog performance, and public relations performance.
Take a look at the complete digital marketing benchmarks for the retail industry below as an example:
Want to uncover the digital marketing benchmarks for your industry? Download your free copy of the complete report today!


