Social media spending is increasing, putting more pressure on marketers to track and prove ROI. Luckily, you can stay on top of your performance by tracking the right metrics in a social media analytics dashboard.
Why marketing teams need a social media analytics dashboard
The CMO Survey projects that the share of marketing budgets spent on social media will double from 10.7 percent in 2015 to 23.8 percent in 2020.
Despite this dramatic expected increase in social spending, over 60 percent of B2C chief marketing officers can’t quantify the impact of social media and almost 50 percent of B2B CMOs say they haven’t been able to prove how social affects their business, according to eMarketer.
This suggests that businesses understand how important social is for promoting brands, but can’t directly tie social performance to revenue.
Why is there a disconnect?
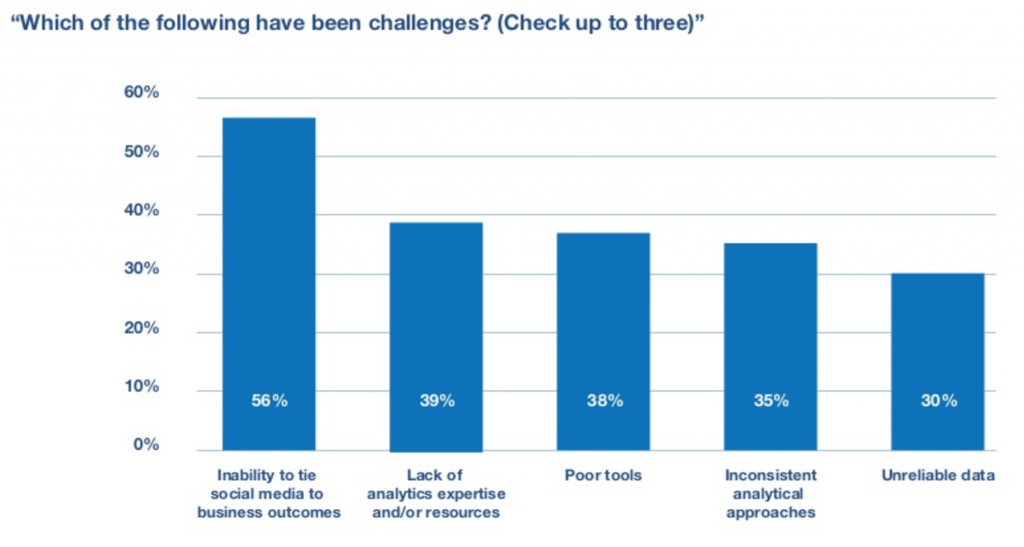
A study by Altimeter examined why organizations struggle to prove the ROI of their social media efforts. The results expose a broken foundation for social media analytics:
- 56 percent: An inability to tie social media to business outcomes.
- 39 percent: A lack of analytics, expertise, or resources.
- 38 percent: Poor tools.
- 35 percent: Inconsistent analytical approaches.
- 30 percent: Unreliable data.
And it makes sense.
Unlike display ads or email campaigns, social media has been unable to prove its contribution to business outcomes. This often causes social to be left behind when it comes to effectively planning marketing strategy and reporting on business results from marketing campaigns.
“Despite the fact that companies are spending so much more on social, they are not integrating it more into their overall marketing strategies,” Christine Moorman director of the CMO Survey told The Wall Street Journal. “It is a major missed opportunity.”
So how do marketers bridge the gap?
As the Altimeter study indicates, data integration, attribution, and reporting are essential. And all of these facets can be addressed with one well-crafted social media analytics dashboard.
By identifying the right metrics to track for your brand, connecting them to other marketing activities and business outcomes, and making them easily accessible, a social media analytics dashboard will help you prove the ROI of your marketing team’s efforts.
Identify the best social media metrics for your business
The first step in building your social media analytics dashboard is to identify the best metrics for tracking and reporting success.
Your dashboard metrics must be closely aligned with your social media marketing goals to help you improve your strategy and prove your success.
This means looking at what is important to your company and connecting social media marketing activities to business objectives.
For example, for a retail company, measuring the influence of campaigns on repeat purchases through the use of UTM tracking tags is one valuable way to tie social to revenue.
If increasing brand awareness is a top business goal, comparing the number of interactions for your brand versus competitors on social will prove how marketing contributes to your company’s competitive edge.
And by connecting a tool like Google Analytics to your social platforms, you can see how social traffic affects conversions.
Make sure you have these goals and KPIs in mind as you are building your dashboard, to ensure you are using the right metrics to measure success.
Build out your social media dashboard by distribution type
Now let’s dive into your strategy to find out how your social media analytics dashboard can help you improve your social strategy.
When evaluating how to improve your social strategy, you should always ask yourself two questions:
- Where do I want to invest more?
- What looks like a total waste of time?
In addition to testing out new social marketing ideas, you should examine your past performance to invest more in the strategies that worked, and get rid of the strategies that didn’t.
In your social media analytics dashboard, break down your data in the following ways to analyze the effectiveness of your social strategy:
Channel by channel
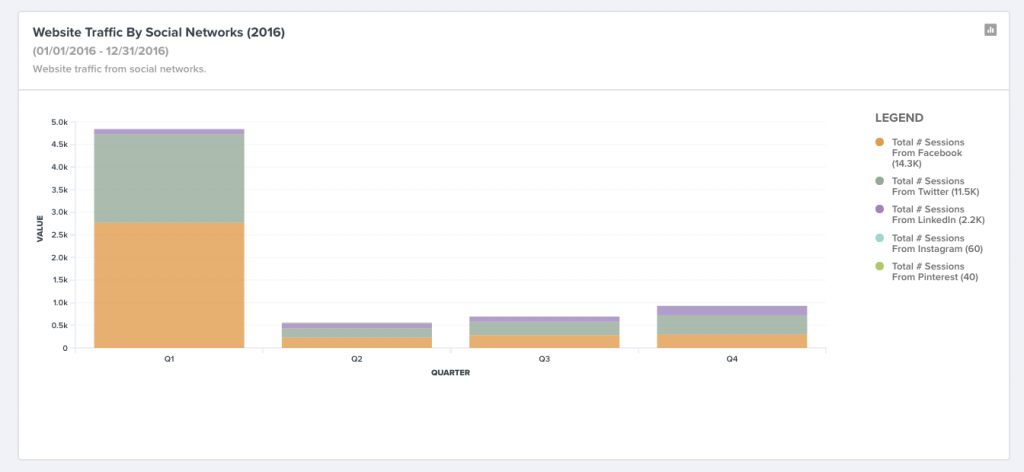
Compare how well different channels perform for your brand. If your software allows you to connect Google Analytics data to your social media analytics, track goal completions by channel over time.
For example, are your Facebook posts really driving traffic and conversions on your website? Then dedicate more resources to Facebook. Is Pinterest driving a lot of engagement, but failing to drive customers to your website or get them to convert? Evaluate your strategy, and either improve your tactics or downgrade the amount of resources dedicated to Pinterest.
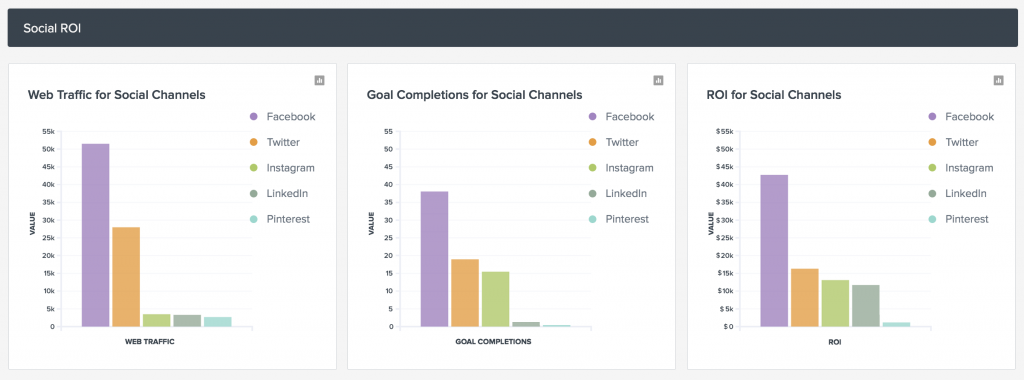
Take this channel analysis a step further by tracking the revenue resulting from specific social channels over time, as in the example below from the TrackMaven platform.
Paid vs. organic campaigns
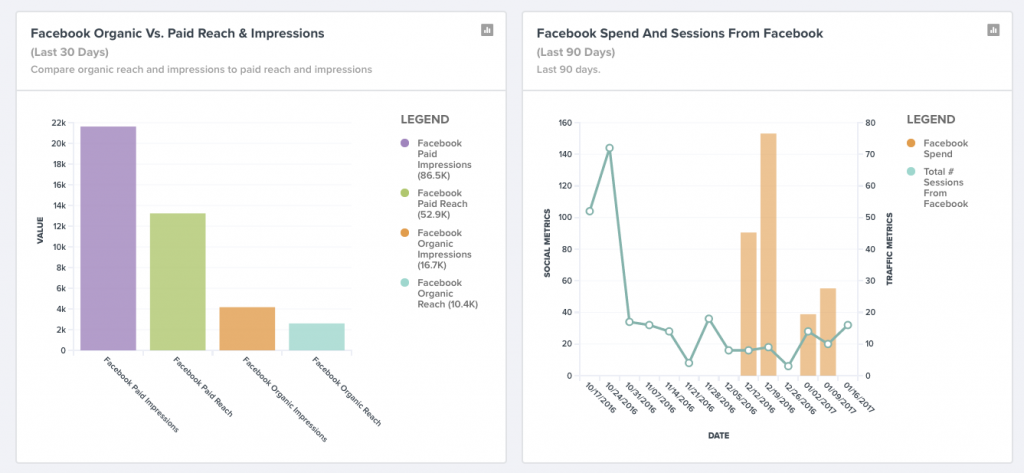
Compare the performance of paid versus organic social post to determine whether or not your investments are driving the results you need. This will also help you identify successful organic campaigns that could benefit from some monetary support.
As always, measure results from paid and organic campaigns as far down-funnel as you can. In the example below, this business measures Facebook referral traffic and spend to understand how that investment drives website visitors.
Topical analysis
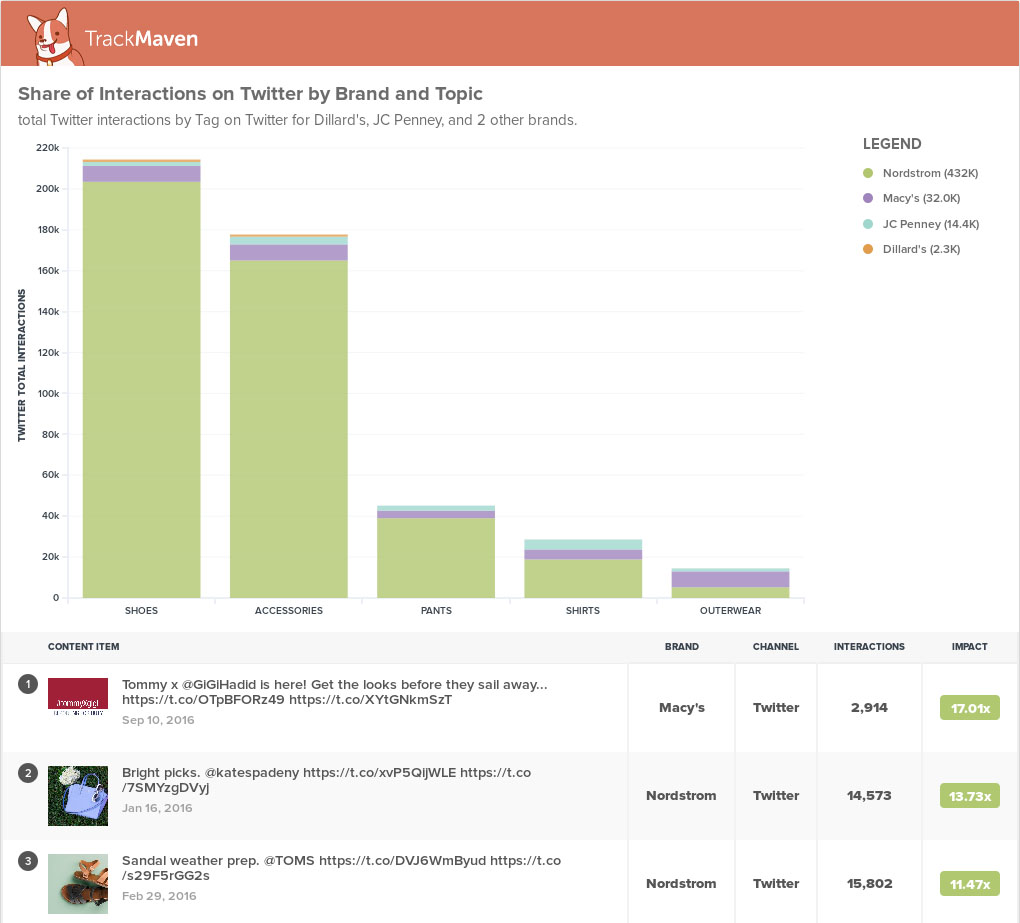
Find out which topics perform best for you on each social channel by tagging posts by topic. For example, want to find out which channels are better for promoting women’s versus men’s wear? Use topic and trend analysis to understand how each topic performs on specific social networks.
Best times to post
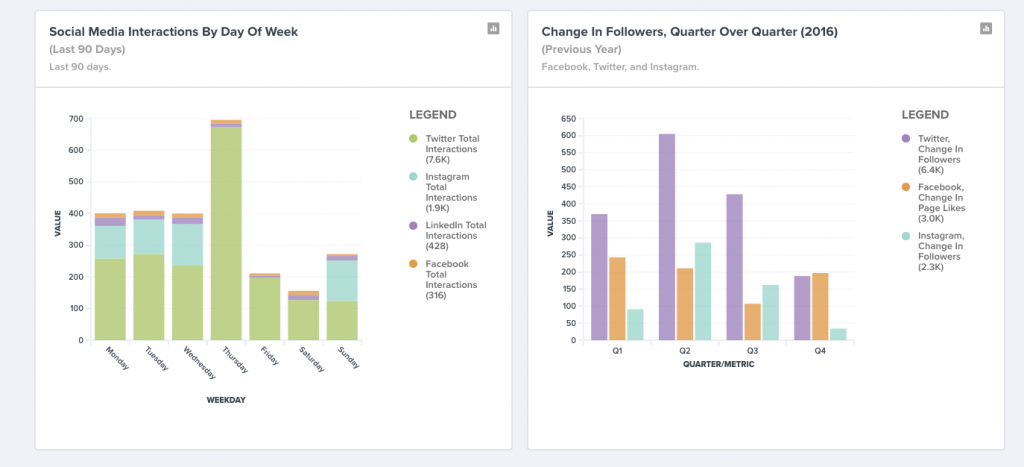
Compare the best times to post during the week by comparing engagement by day of the week. Use this information to drive more impact from your social media presence, without creating more content.
Incorporate competitive insights into your social dashboard
Keeping ahead of the competition is not only important to you as a marketer, it’s also really important to high-level stakeholders in your company.
Being able to report on who you’re beating on social and finding out when a competitor creates a viral social media post (before your boss does!) is crucial to connecting your social media activities to business outcomes.
Key competitive insights to pin to your social media analytics dashboard include:
Share of voice
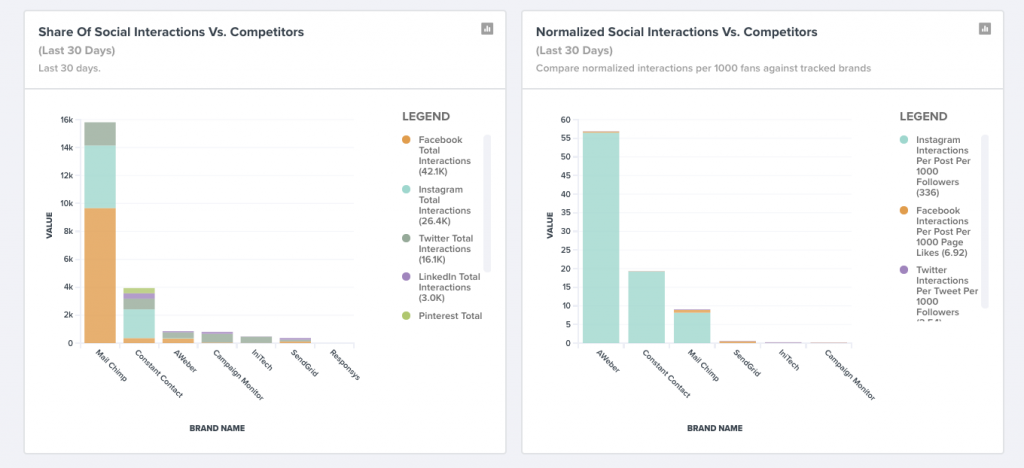
Compare the number of interactions your social content gets versus your competitors across different social channels to find out who owns industry conversations and consumer attention.
Engagement by topic
Get more granular insights into your share of voice on social by breaking down which topics you are dominating, or need to be more vocal about, versus your competitors across social channels. You can do this by tracking posts with different topics, and incorporating a performance graph in your social media analytics dashboard.
Social media audience acquisition
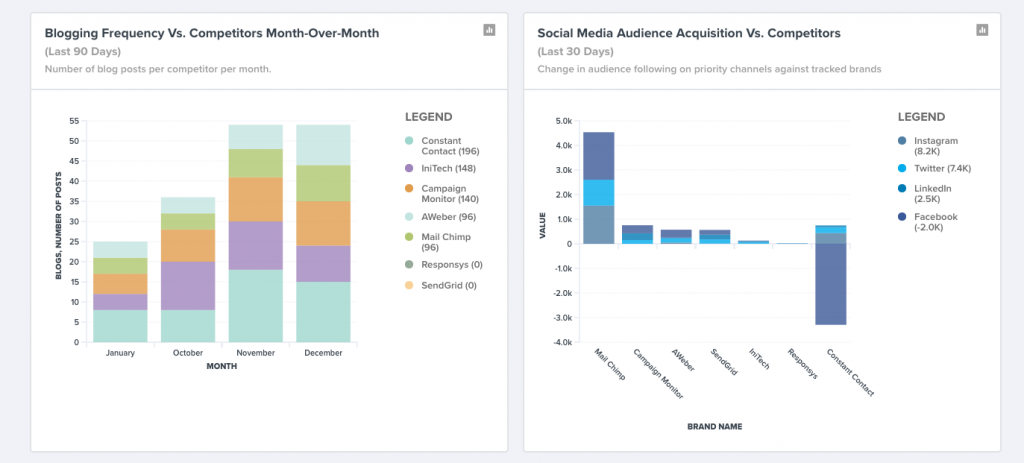
It’s better to focus on quality of social referral traffic rather than quantity. But if brand awareness is your goal, then keeping track of your social media follower growth versus competitors will help you understand how competitors’ social strategies are evolving, and keep you prepared for related questions from stakeholders.
Use your dashboard to track and prove social media ROI
No social media marketing dashboard is complete without ROI data.
Make sure you track ROI by connecting your web analytics and (for B2B companies) lead generation data to your social strategy. In your dashboard, track Google Analytics goal conversions from each of your social networks to see how well social traffic converts on your website.
Then compare the ROI from different social channels over time to prove and improve your social media marketing investments.
What your social media analytics dashboard tool should do for you
If you remember from the top of this piece, 38 percent of marketers say they are unable to tie their social efforts to business results because of poor tools. If you’re searching for a social media reporting tool to help you build your dashboard, here is what you should look for in your tool of choice:
Custom metrics and graphs
Make sure the tool lets you customize metrics and graphs to help you measure success against your social media marketing goals.
Integrated data from multiple sources
Your tool should incorporate all relevant business and marketing data into your dashboard so that you can make decisions with the big picture in mind. This includes incorporating data from web analytics, social platforms, marketing automation, CRM, and more to provide real-time updates.
Competitor and industry comparisons and benchmarks
Your social media reporting tool should give you access to competitive insights from influencers and competitors, as well as industry benchmarks.
Data visualization
The reporting tool should provide data visualizations that allow you to not only calculate social media ROI, but see how it changes over time.
Reports customized for your business objectives
To keep stakeholders informed, marketing teams need the ability to create custom social media reports in their dashboard reporting tool, preferably in multiple formats, such as images, powerpoint presentations, and PDFs. It’s even better if these reports can easily be shared with colleagues that don’t have a tool login — it’s your data, and it should be accessible across teams.
Real-time collaboration and sharing
Being able to share dashboards and reports across your team is critical if you are going to keep everyone on the same page. For example, if you and a colleague adds a report to your social media analytics dashboard, you should be able to see it! And vice versa.
Social media alerts
Your tool should actively keep you informed of social content that performs well for you, as well as of content that performs well for your competitors. I’ve found email alerts to be the most useful, and easiest to share with colleagues.
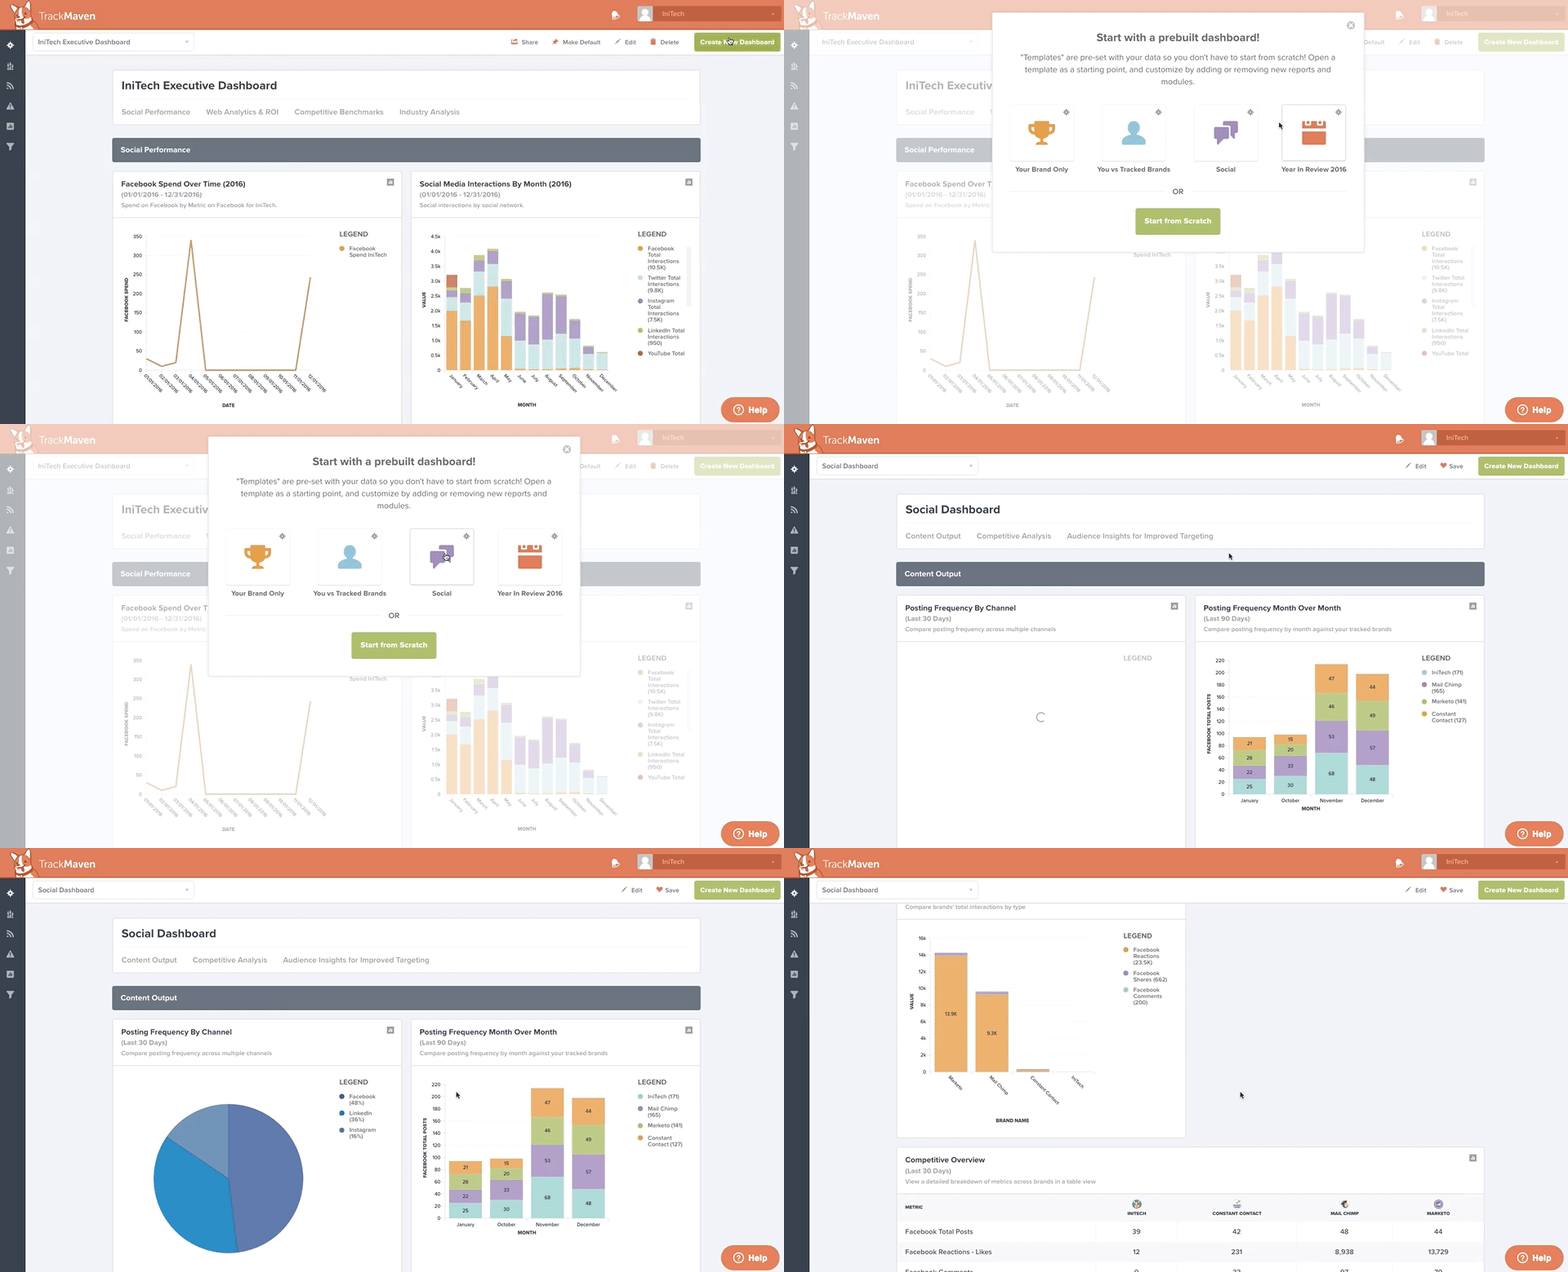
Pre-built social dashboard templates
An added benefit is if a tool already has a social media analytics dashboard template pre-built for you. In fact, TrackMaven has several dashboard templates already built for you!
Proving the value of social media and content is difficult — but not impossible. We created The Marketer’s Field Guide to Social and Content Marketing Attribution to show you how to prove your impact. Get your free copy now!

